


 인쇄
인쇄


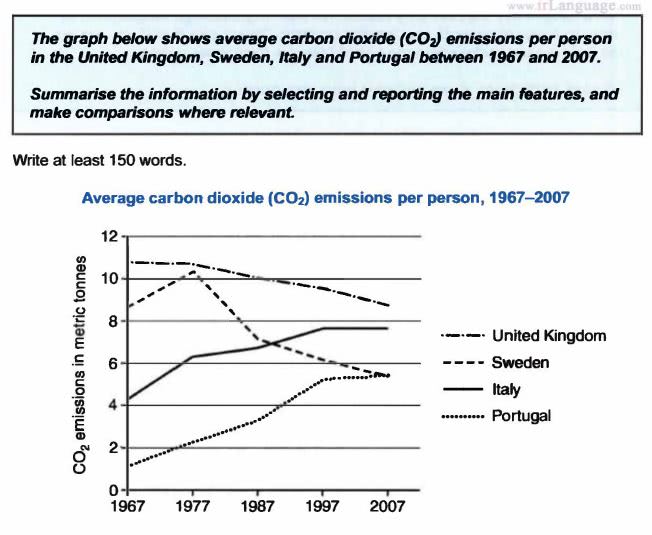
The graph below illustrates how much CO2 emitted per person averagely in the particular 4 European countries from 1967 to 2007.
Overall, Sweden’s average carbon dioxide release per person in 1967~2007 was fluctuated, while the other 3 countries’ those figures showed a steadily upward or downward trend.
In 1977, the figures of CO2 emissions in metric tonnes in Sweden and Italy showed a rapid high-rise tendency. Especially, Sweden’s figures peaked its the highest number in that time. Although Italy maintained this increasing trend, Sweden could not sustain that climbing tendency and it declined to about 7 metric tonnes from roughly 10.3 metric tonnes in 1987. At the first time Sweden was the second-highest CO2 releasing country, but it was reversed in that period because Italy preceded Sweden. Swedish succeeded to decrease CO2 emission continuously, so it finally thrived the last country with having the same figure with Portuguese as about 5.3 metric tonnes in 2007.
Even though the average CO2 emission amount per person continually dropped in the UK, it always sustained its the first position. On the other hand, Portugal’s average CO2 release amount per person continually increased, but it was always the last position among the 4 distinctive countries.

 댓글 0개
댓글 0개


 불편사항 신고