


 인쇄
인쇄


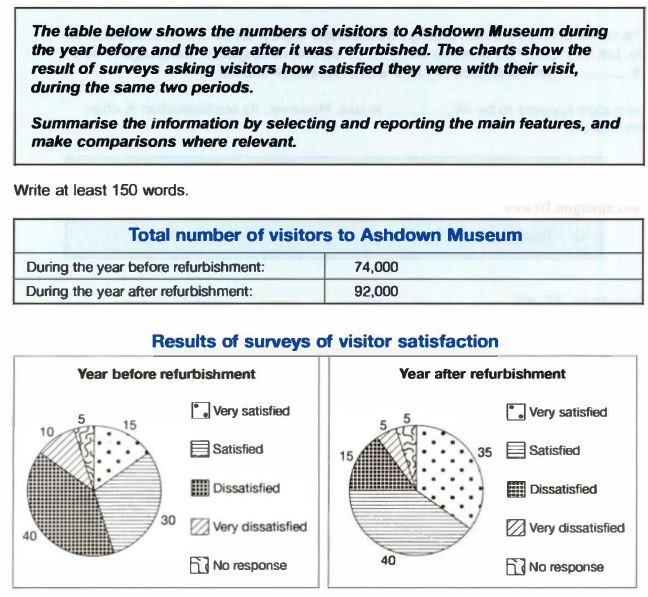
The table chart illustrates the figures of customers to Ashdown Museum the year before and the year after the facility’s refurbishment. The pie chart below describes the outcomes of inquiries of visitors' satisfaction on the given same period.
Overall, the Museum attracted more people after remodeling. The refurbishing changed visitor’s minds as “dissatisfaction” and “very satisfied” ratio’s reversed.
Ashdown Museum only attracted 74,000 people when it was not remodeled for a year. This figure noticeably increased to 92,000 after getting modification. During these periods, a survey inquiring satisfaction was conducted. 40% of people answered that they were dissatisfied with the museum, while 30% of them satisfied. Less of them felt significant emotion with the museum, so “very satisfied” and “very dissatisfied” rates possessed 15% and 10% respectively.
Meanwhile, this trend slightly changed after refurbishing this building. While satisfaction rate increased 30% to 40%, fortunately ‘very satisfied’ proportion grow upto 35% from 15%. This noticeable change showed a whole satisfaction changed to positively. On the other hand, there is still remaining dissatisfaction possession shown in this questionnaire as constituting 15% of ‘dissatisfied’ and 5% of ‘very dissatisfied’. The same 5% of respondents felt nothing about that remodeling before and after the refurbishment.

 댓글 0개
댓글 0개


 불편사항 신고